 October, 2026
The Problem Worth Solving
Saudi Arabia is investing over SAR 30 billion annually in road infrastructure as part of Vision 2030. The data exists — KAPSARC publishes transportation datasets openly — but no public-facing dashboard connects traffic safety to infrastructure development.
I built one. Not because the world needed another dashboard, but because I wanted to see what happens when you wire real government data into a decision-support tool.
Live dashboard: ksa-roads-intelligence-production.up.railway.app
Source code: github.com/ramdev9/ksa-roads-intelligence
What I Built
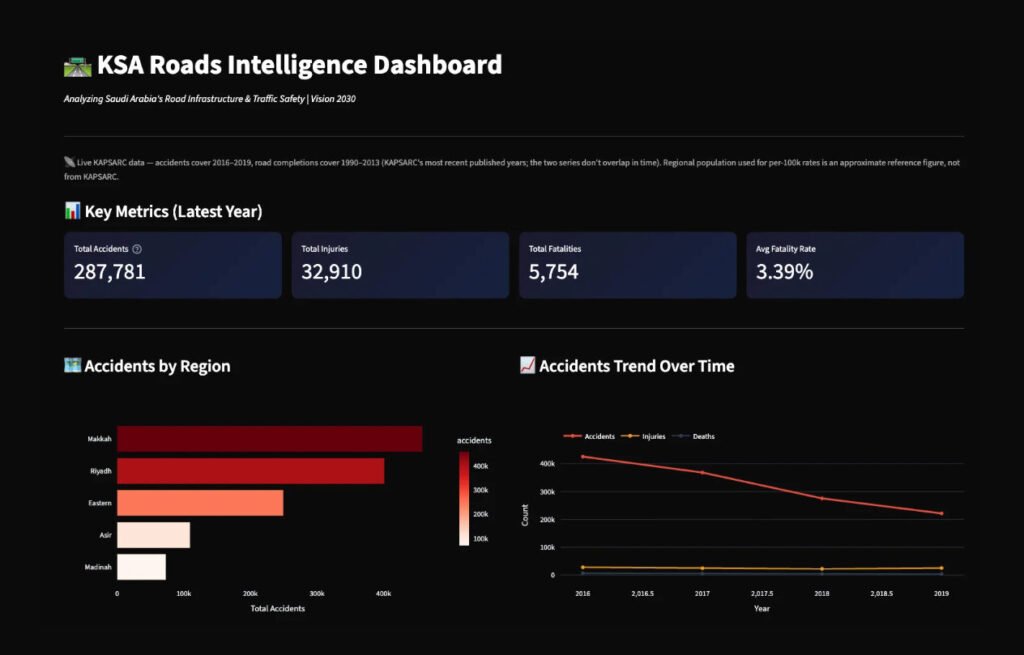
KSA Roads Intelligence is a Streamlit dashboard that visualises Saudi Arabia’s traffic accidents, road development, and cross-border vehicle flows. It pulls from 6 KAPSARC datasets covering 13 administrative regions.
The dashboard includes:
- Regional accident rates normalised per 100K population
- Year-over-year trend analysis
- A composite risk score ranking regions by safety priority
- King Fahd Causeway traffic between Saudi and Bahrain
- Vehicle crossings by major Saudi cities
The Constraints That Shaped Everything
Here’s what the KAPSARC catalog promised versus what I actually got:
Traffic Accidents: Catalog says “2008+”. Downloaded CSVs contain 2016–2019 only. Four years of data per region.
Road Development: Covers 1990–2013. No overlap with accident data. Zero correlation analysis possible.
Trade & Transport: Global dataset with 298 countries. Saudi Arabia rows? All null. Completely empty.
This is normal. Real data is messy. The PM skill isn’t pretending it’s clean — it’s documenting the gaps and building around them.
Why I Didn’t Forecast
With 4 data points per region, I could have run ARIMA or Prophet and gotten a number. But that number would be noise dressed as signal.
Instead, I built a risk scoring model:
- 40% weight on fatality rate (severity matters most)
- 30% weight on accidents per 100K (volume, normalized)
- 30% weight on year-over-year trend (direction of change)
Tercile cutoffs rank regions into High/Medium/Low risk. It’s not a forecast — it’s a prioritization framework. The methodology is documented in an expander on the live dashboard so anyone can audit the logic.
Architecture Decisions
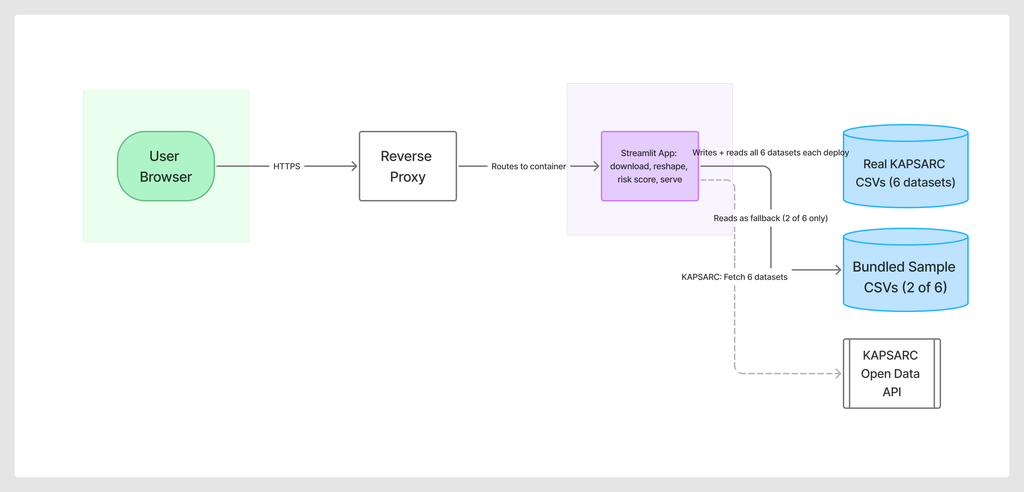
Tech stack: Python, Streamlit, Plotly, Pandas. Deployed on Railway with automatic GitHub deploys.
Data strategy: Sample data bundled in the repo for local development. Real KAPSARC data pulled via download script. Graceful fallback if API is unreachable.
Why Streamlit over React? Speed to deploy. For a data dashboard where the primary interaction is filtering and exploring, Streamlit’s built-in widgets beat building a custom frontend.
What I’d Do Differently
Geocoding: A map visualization would make the regional comparisons more intuitive. KAPSARC doesn’t include coordinates, so I’d need to join against a separate Saudi regions shapefile.
Arabic localization: The dashboard is English-only. For a Saudi-focused tool, RTL support and Arabic labels would expand the audience.
Real-time feeds: KAPSARC publishes annually. For operational use, you’d want integration with traffic management APIs — if they exist publicly.
The PM Lesson
Data projects are constraint management. The interesting decisions aren’t technical — they’re about what you don’t build when the data doesn’t support it.
I could have shipped a dashboard with a “2025 Forecast” chart. It would have looked impressive. It would have been wrong.
The harder, better move: document the limitation, build something defensible, and let the methodology speak for itself.
Try it: Live Dashboard | GitHub Repo